Documentation Version 0.1 – April 25, 2021
Introduction
This guide will provide detailed instructions on setting up a dashboard application for logging and monitoring a temperature sensor connected to the Helium Lorawan network. All of the supporting open source software will run on a Raspberry Pi. A software firewall will also be setup for secure operation on your home network.
This guide assumes that you have some familiarity in using a Raspberry Pi and accessing it via SSH. The Pi will be run in headless operation(no monitor, keyboard, mouse). Communication between the Pi and the Helium network requires that you are able to open up a port on your home modem/router. It is not a guide for beginners however I have tried to provide detailed step by step instructions.
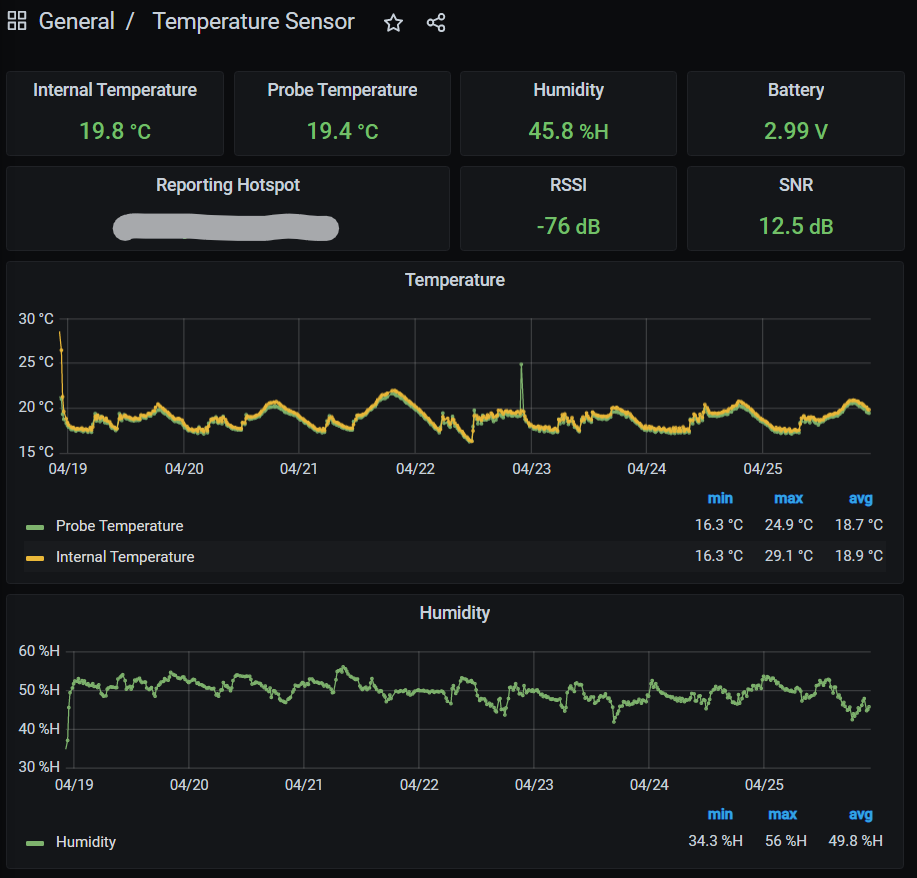
Screenshot of dashboard
Requirements
The following items are required:
- Dragino LHT65 Lorawan Temperature and Humdity Sensor
- Raspberry Pi4 with at least 2GB RAM and 16 GB SD Card
- Admin access to your home router and an ISP that allows you to open ports to allow inbound connections.
- Helium Hotspot(Lorawan Gateway) within RF range of your sensor.
- Helium Console account with data credits.
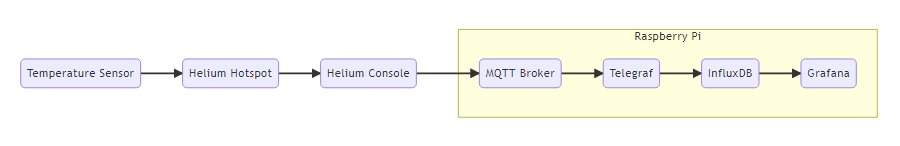
Raspberry Pi Software & Data Flow Overview
The following shows the basic flow of the Temperature sensor data through the Helium network and to the Raspberry Pi for processing and display.
Ubuntu 20.10 Server
We are going to be using Ubuntu operating system instead of Raspberry Pi OS(formerly Rasbian). Raspberry Pi is now officially supported by Ubuntu and I am using it for most of my projects.
Mosquitto MQTT Broker – Version 1.6.12-1
Eclipse Mosquitto is an open source message broker that implements the MQTT protocol. MQTT is the communication protocol used to send messages from the helium console/router to the Raspberry Pi.
Telegraf – Version 1.18.1-1
Telegraf is “server agent”. It can collect data from a wide array of inputs and then write them to various different outputs. We are going to use Telegraf to read the data from the MQTT broker and write to InfluxDB database.
InfluxDB – Version 1.8.4-1
InfluxDB is an open source time series database developed by InfluxData. It is a great database for storing large amounts of timestamped data which is perfect for IoT sensors. InfluxDB V2.X is now available which is a major upgrade however for now I am sticking with V1.8 for my projects until I have more time to understand any issues with migration.
Grafana – Version 7.5.1
Grafana is an open source visulization and analytics software. It will read data from InfluxDB database display on configurable dashboards. Grafana is a great tool for analyzing sensor data over long periods of time.
Prepare Raspberry Pi
Update firmware Bootloader
If you are using an older Pi4 then it likely has an outdated bootloader. You might not need an updated bootloader for your project but I like to do this for any new projects I start.
You can use my guide for updating bootloader:
https://www.friendsoflittleyus.nl/upgrade-bootloader-firmware-on-raspberry-pi-4/
Write Ubuntu to SD Card(>16GB)
I would recommend using a high quality name brand SD card if you plan on running for an extended period of time.
- Download & Extract Ubuntu Server 20.10 64-bit Version (non desktop version)
- https://ubuntu.com/download/raspberry-pi
- Download & Install Raspberry Pi Imager v1.6 Software
- https://www.raspberrypi.org/downloads/
- Write Ubuntu Image to SD card
- Insert SD card into Raspberry Pi
Optional: Use External USB3.0 SSD instead of SD Card.
SD cards do not like repetitive erase/write cycles which you get with applications like this. An external SSD is great option and is also much faster than SD card memory access. See link below for guide on setting up external boot.
https://www.friendsoflittleyus.nl/boot-ubuntu-server-20-x-from-external-usb-ssd-on-raspberry-pi4/
Configure Ubuntu with Headless Operation + Ethernet Connection
The following section will configure Ubuntu with a new user and setup basic firewall.
- Power up Raspberry Pi
- Wait a couple of minutes for initial bootup
- Determine local IP address of Raspberry Pi using your favorite method or one of these:
- login into your router and check the DHCP client list. Default hostname of the Pi is ubuntu
- Fing is nice application on Android for scanning devices on your network
- Open SSH connection using your favorite application(example: putty)
- Default login
- user: ubuntu
- password: ubuntu
- On first login you will be asked to change default password
- SSH session will be automatically closed as soon as password is changed
- Default login
- Login with new password
- Switch to root environment
sudo -i - Update Time Zone(optional) Configure according to this guide
- To get list of available timeszones:
timedatectl list-timezones - Configure Timezone (Example)
timedatectl set-timezone America/Edmonton
- To get list of available timeszones:
- Obtain latest versions of installed packages
apt update - update all installed packages
apt upgrade - Configure basic firewall. Open SSH port for local network access only
ufw allow from 192.168.1.0/16 to any port 22 && ufw enable - Open file and change hostname from ubuntu to helium-iot
nano /etc/hostname - Open file and add this line:
127.0.0.1 helium-iotnano /etc/hosts - Add new user and password.
adduser helium && usermod -aG sudo heliumexitexit - Close SSH connection and login using new user
- Switch to root environment
sudo -i - Delete ubuntu user info
deluser ubunturm -rf /home/ubuntu - Clear terminal history
history -c && history -wexit - Find MAC address(optional). This can be useful when we configure port forwarding later on in the guide. The first address displayed is the ethernet connction.
LANG=C ip link show | awk '/link\/ether/ {print $2}' - Clear terminal history
history -c && history -w - Reboot with new settings
sudo reboot
Install Mosquitto MQTT Broker (Ver 1.6.12-1)
reference: http://www.steves-internet-guide.com/install-mosquitto-linux/
Install Mosquito broker and clients
- Switch to root environment
sudo -i - Update Ubuntu’s package list
apt-add-repository ppa:mosquitto-dev/mosquitto-ppaapt-get update - Install broker and clients
apt-get install mosquitto mosquitto-clientsapt clean
Configure MQTT Passwords
Configure Mosquitto to use passwords instead of annonymous login.
Reference: https://mosquitto.org/man/mosquitto_passwd-1.html
We have 3 applications that require user accounts. These are the usernames and passwords I used but make sure to use your own unique passwords.
- Helium Console:
- User: heliumconsole
- Password: heliumRocks
- Telegraf
- User: telegraf
- Password: telegraf33
- MQTT Explorer
- User: mqtt_explorer
- Password: mqtt_explorer33
- Create Password file with initial user account. Replace sammy with your username.
mosquitto_passwd -c /etc/mosquitto/passwd sammy - Open up new configuration file for Mosquitto and tell it to use this password file to require logins for all connections
nano /etc/mosquitto/conf.d/default.conf - Paste in the following and then close file
allow_anonymous falsepassword_file /etc/mosquitto/passwd - Create user account for helium console (use your own password)
mosquitto_passwd -b /etc/mosquitto/passwd heliumconsole heliumRocks - Create user account for MQTT explorer tool (use your own password)
mosquitto_passwd -b /etc/mosquitto/passwd mqtt_explorer mqtt_explorer33 - Create user account for telegraf (use your own password)
mosquitto_passwd -b /etc/mosquitto/passwd telegraf telegraf33 - Change default port (optional). Open configuration file
nano /etc/mosquitto/conf.d/default.conf - Paste this line at the bottom of the file to change the default port from 1883 to 1884
listener 1884 - Restart Mosquitto
service mosquitto stopservice mosquitto start - Check to make sure service started
service mosquitto status - Open MQTT port on firewall(default is 1883)
ufw allow 1884
Note: Use the following command to add additional user accountsmosquitto_passwd -b /etc/mosquitto/passwd user password
Configure ACL(access control list)
If you do not configure access control then all users will have full read/write access to all topics.
Reference: https://medium.com/jungletronics/mosquitto-acls-ac062aea3f9
Reference: https://www.chirpstack.io/project/guides/mqtt-authentication/
- Open Mosquitto configuration file
nano /etc/mosquitto/conf.d/default.conf - Add the following to the file and close it.
acl_file /etc/mosquitto/acls - Create and open access control list file
nano /etc/mosquitto/acls - Copy the following to configure desired access control for each user.
#give full read access to $SYS topic.
pattern read $SYS/#

#give **heliumconsole** /read/write access to **helium** topic
user heliumconsole
topic helium/#

#give **telegraf** read access to all topics.
user telegraf
topic read #

#give **mqtt_explorer** read access to all topics.
user mqtt_explorer
topic read #
Mosquitto should now be configured and running.
Install InfluxDB
The vendor repositories from InfluxData will be used.
Installed Version: 1.8.4-1
See the following link for the lastest stable releases:
https://repos.influxdata.com/debian/dists/buster/stable/binary-arm64/Packages
- Update Repositories
curl -sL https://repos.influxdata.com/influxdb.key | sudo apt-key add -echo "deb https://repos.influxdata.com/debian buster stable" | sudo tee /etc/apt/sources.list.d/influxdb.listsudo apt-get update
- Install
sudo apt-get install -y influxdb - Enable services
sudo systemctl enable influxdbsudo systemctl start influxdb - The successful start can be verified via
sudo systemctl status influxdb.service
Configure InfluxDB for use with your sensors
Create Database with the following parameters
- database name: helium_sensors (no retention policies)
- user: helium_sensors_user
- password: helium_sensors_password
- Start influx console
influx - create database within InfluxDB console
> create database helium_sensors
> use helium_sensors
> create user helium_sensors_user with password 'helium_sensors_password' with all privileges
> grant all privileges on helium_sensors to helium_sensors_user
> exit
Install Grafana
The vendor repositories from Grafana will be used.
Installed Version: 7.5.1
- Update Repositories
curl -sL https://packages.grafana.com/gpg.key | sudo apt-key add -echo "deb https://packages.grafana.com/oss/deb stable main" | sudo tee /etc/apt/sources.list.d/grafana.listsudo apt-get update
- Install
sudo apt-get install -y grafana - Enable services
sudo systemctl enable grafana-serversudo systemctl start grafana-server - The successful start can be verified via
sudo systemctl status grafana-server.service
Restart Grafanasudo service grafana-server restart
Configure Grafana
I have multiple Pis running Grafana at my home and each one needs to use a unique port. We are going to change the default port from 3000 -> 3002. We will open up the port on the firewall. We will also configure the dashboard to be readable without logging into an account. You will need to login to an account to modify the dashboard.
- Switch to root environment
sudo -i - open grafana configuration file
nano /etc/grafana/grafana.ini - Search for line =
;http_port = 3000and change tohttp_port = 3002 - Open port on firewall.
ufw allow 3002/tcp - Make Grafana dashboard public without login. Edit Grafana config file
nano /etc/grafana/grafana.ini - in the [auth.anonymous] section make the following changes.
[auth.anonymous]
# enable anonymous access
enabled = true

# specify organization name that should be used for unauthenticated users
org_name = Main Org.

# specify role for unauthenticated users
org_role = Viewer- Restart Grafana
service grafana-server restart - Open the following URL in your webbrowser: to reach the login screen.
http://RASPBERRYPI_IPADDRESS:3002/login
Default login is user=admin, password=admin
It will ask you to change the default password. Change default login info:
username: admin
password: heliumiot (use your own password)
Install Telegraf – 1.18.1-1
Installed Version: 1.18.1-1
https://repos.influxdata.com/debian buster/stable arm64 telegraf arm64 1.18.1-1
- Update Repositories
Repositories were updated when we installed InfluxDB. - Install
sudo apt-get install -y telegraf - Enable services
sudo systemctl enable telegrafsudo systemctl start telegraf - The successful start can be verified via
sudo systemctl status telegraf.service
Configure Telegraf
To send MQTT data to InfluxDB, uncomment and/or alter the following sections of the central Telegraf configuration file.
sudo nano /etc/telegraf/telegraf.conf
[[outputs.influxdb]]
   urls = ["http://127.0.0.1:8086"]
   database = "helium_sensors"
   username = "helium_sensors_user"
   password = "helium_sensors_password"
We need to configure Telegraf to read MQTT packets
To complement the Telegraf configuration it is better to use the /etc/telegraf/telegraf.d directory and create a new file named mqtt.conf. Telegraf reads every file ending with .conf in this directory when reloaded.
sudo nano /etc/telegraf/telegraf.d/mqtt.conf
[[inputs.mqtt_consumer]]
#  servers = ["tcp://192.168.1.76:1883"]
  servers = ["tcp://127.0.0.1:1884"]
  qos = 0
  connection_timeout = "30s"
  topics = [ "helium/#" ]
  username = "telegraf"
  password = "telegraf33"
  data_format = "json"
  json_string_fields = ["name","device_id","hotspot_name","spreading"]
Telegraf needs a reload to read the new config
Check the status of the service for errors.sudo systemctl reload telegraf.servicesudo systemctl status telegraf.service
Configure First Grafana Dashboard
- Open Grafana: http://192.168.1.75:3002/login
username: admin
password: heliumiot - Add the InfluxDB as a datasource
Use menu Configuration->Data Sources to add the helium_sensors database credentials created previously. Press “Save & Test”. Database:helium_sensors
User: helium_sensors_user
Password: helium_sensors_password
Add Dashboard
Download Reference Temperature Monitor Dashboard:
https://gist.github.com/Nybble-IOT/1111d8ca371bce8681f467e90380e7ac
menu: Dashboard->Manage
Select: Import
Select: Upload JSON file
Upload the JSON file previously downloaded.
Select “InfluxDB” as the data sources.
Set as your default home dashboard
menu: Dashboards->Home
Under “Recently viewed dashboards” you will see the new dashboard you created. Star it.
menu: Configuration->Preferences
You can select the new dashboard as the “Home Dashboard”
Now the temperature monitor dashboard will load immediately when logging in.
Setup up Port Forwarding or DMZ
You will need to open up a port on your internet provider’s modem/router so that the Helium Console router is able to access the MQTT broker.
The default port for MQTT is usually 1883. During setup we modified the port to be 1884 so open up the desired port that you configured.
If you want to view your dashboard from outside of your home network then you will need to also open up the Grafana port. The default port for Grafana is 3000. During setup we modified the port to be 3002 so open up the desired port that you configured.
Onboard Temperature Sensor onto Helium Network
Create Helium Console Account
Use the guide below to create an account on Helium’s Console application.
The Console application is used to onboard Lorawan sensors onto the Helium Network.
https://docs.helium.com/use-the-network/console/quickstart/
Add LHT65 Temperature Sensor to Helium Console
Helium has a great guide below for adding the temperature sensor to the Helium Console.
https://docs.helium.com/use-the-network/devices/ready-to-use/dragino-lht65
If you have successfully onboarded the sensor, added a decoder function, and are receiving data to the console than we can proceed to add the MQTT integration between Helium Console and our Raspberry Pi.
Connect MQTT Integration to Temperature Sensor
Use the following link as a guide to adding an MQTT integration.
https://docs.helium.com/use-the-network/console/integrations/mqtt/
You will need to find the external IP address(IPv4) of your modem. If you don’t know it you can use this website:
https://whatismyipaddress.com/
Use the following parameters:
Endpoint: mqtt://username:password@ipaddress:port
Example:
mqtt://heliumconsole:heliumRocks@xxx.xxx.xxx.xxx:1884
User: heliumconsole
Password: heliumRocks
Integration Name: LHT65 MQTT on Pi Integration
Save by pressing “Add Integration” button.
Connect everything using labels.
- Create a Label called: “LHT65 MQTT on Pi“
- Add label attachements to “LHT65 MQTT on Pi Integration” and “LGT65 Decoder“
- Save by pressing “Add Label and Manage”
- Press “Add this label to a Device” button.
- Select the LHT65 device
The MQTT integration should now be setup and data should be published to your MQTT broker running on the Pi.
This is what the JSON packet should look like.
{
   "app_eui":"xxxxxxx",
   "decoded":{
      "payload":{
         "BatV":3.043,
         "Ext_sensor":"Temperature Sensor",
         "Hum_SHT":"45.9",
         "TempC_DS":"327.67",
         "TempC_SHT":"20.53"
      },
      "status":"success"
   },
   "dev_eui":"xxxxxxx",
   "devaddr":"xxxxx",
   "fcnt":8,
   "hotspots":[
      {
         "channel":9,
         "frequency":904.0999755859375,
         "id":"xxxxxxxxx",
         "lat":53.5354394660782,
         "long":-113.27811781112322,
         "name":"xxx-xxx-xxx",
         "reported_at":1618462238222,
         "rssi":-94.0,
         "snr":9.800000190734863,
         "spreading":"SF10BW125",
         "status":"success"
      }
   ],
   "id":"xxxxxxxxx",
   "metadata":{
      "labels":[
         {
            "id":"xxxxxxxxx",
            "name":"LHT65 Decoder",
            "organization_id":"xxxxxxxxx"
         },
         {
            "id":"xxxxxxxxx",
            "name":"LHT65 MQTT on Pi",
            "organization_id":"xxxxxxxxx"
         }
      ],
      "multi_buy":1,
      "organization_id":"xxxxxxxxx"
   },
   "name":"LHT65 #3",
   "payload":"y+MIBQHLAX//f/8=",
   "payload_size":11,
   "port":2,
   "reported_at":1618462238222,
   "uuid":"xxxxxxxxx"
}
Integration Template
I have found that many applications do not really like JSON with multiple levels of hierarchy. When you setup the Helium integration there is a section for defining a template. This can be used to modify the JSON sent.
The following template will flatten and extract just the data we are interested in. Copy the following to the Template Body and press Save.
{
  "name": "{{name}}",
  "device_id": "{{id}}",
  "reported_at": "{{reported_at}}",
  {{#hotspots}}
  "hotspot_name": "{{name}}",
  "rssi": {{rssi}},
  "snr": {{snr}},
  "spreading": "{{spreading}}",
  "raw_data": "{{payload}}",
  {{/hotspots}}
  {{#decoded}}{{#payload}}"ext_sensor": "{{Ext_sensor}}",
  "battery": {{BatV}},
  "humidity_int": {{Hum_SHT}},
  "temperature_ext": {{TempC_DS}},
  "temperature_int": {{TempC_SHT}}{{/payload}}{{/decoded}}
}
Testing
If everthing is configure correctly then you should start seeing temperature data show up on the Grafana dashboard.
MQTT Explorer
MQTT Explorer is my favourite tool for viewing an overview of all the MQTT activity on a broker. You can use this to verify that the Helium Console is successfully sending packets to your broker.
http://mqtt-explorer.com/
You can verify that the Telegraf plugin is able to subscribe to the MQTT packets and is writing data to InfluxDB.sudo influx
> use helium_sensors> select * from mqtt_consumer limit 5
If data has been received then the response will be a table with all the data.